Every credit union board asks the same question: is our loan book growing safely? The data to answer it is already in your systems. The problem is that most dashboards show you the numbers without telling you what they mean. Especially when trying to track credit union lending metrics effectively.
Decision volumes, turnaround times, delinquency rates – the numbers are there. Most of them sit unused. A metric that’s down 20% week-on-week could mean something is broken, or it could be normal variation. Additionally, a rising bad loan rate could signal a policy problem, or it might simply reflect a deliberate change in risk appetite. Without the context to distinguish one from the other, lending managers default to instinct, executives struggle to make the case at board level, and the data that should be driving better decisions generates more questions than answers.
NestEgg Performance Analytics is designed to close that gap.
Two views of your lending operation
Performance Analytics organises your decisioning data into two connected views – Operational Health and Portfolio Health. Each answers a different question, but the real value is in reading them together: operational metrics tell you how you’re lending; portfolio metrics tell you whether those decisions are paying off.
Operational Health: how efficiently are we running right now?
These metrics update weekly and cover the data that most directly affects member experience and decision quality.
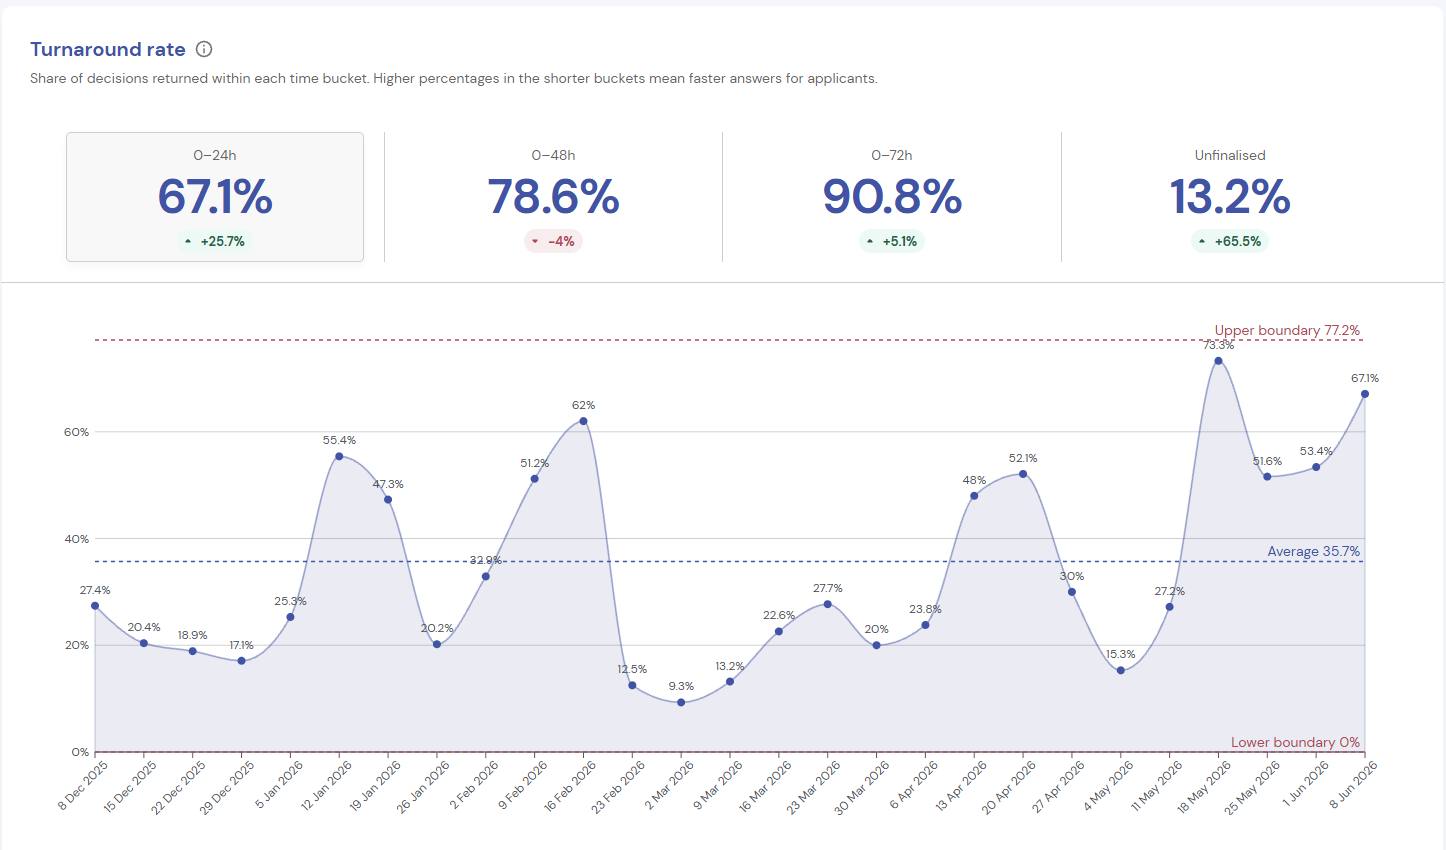
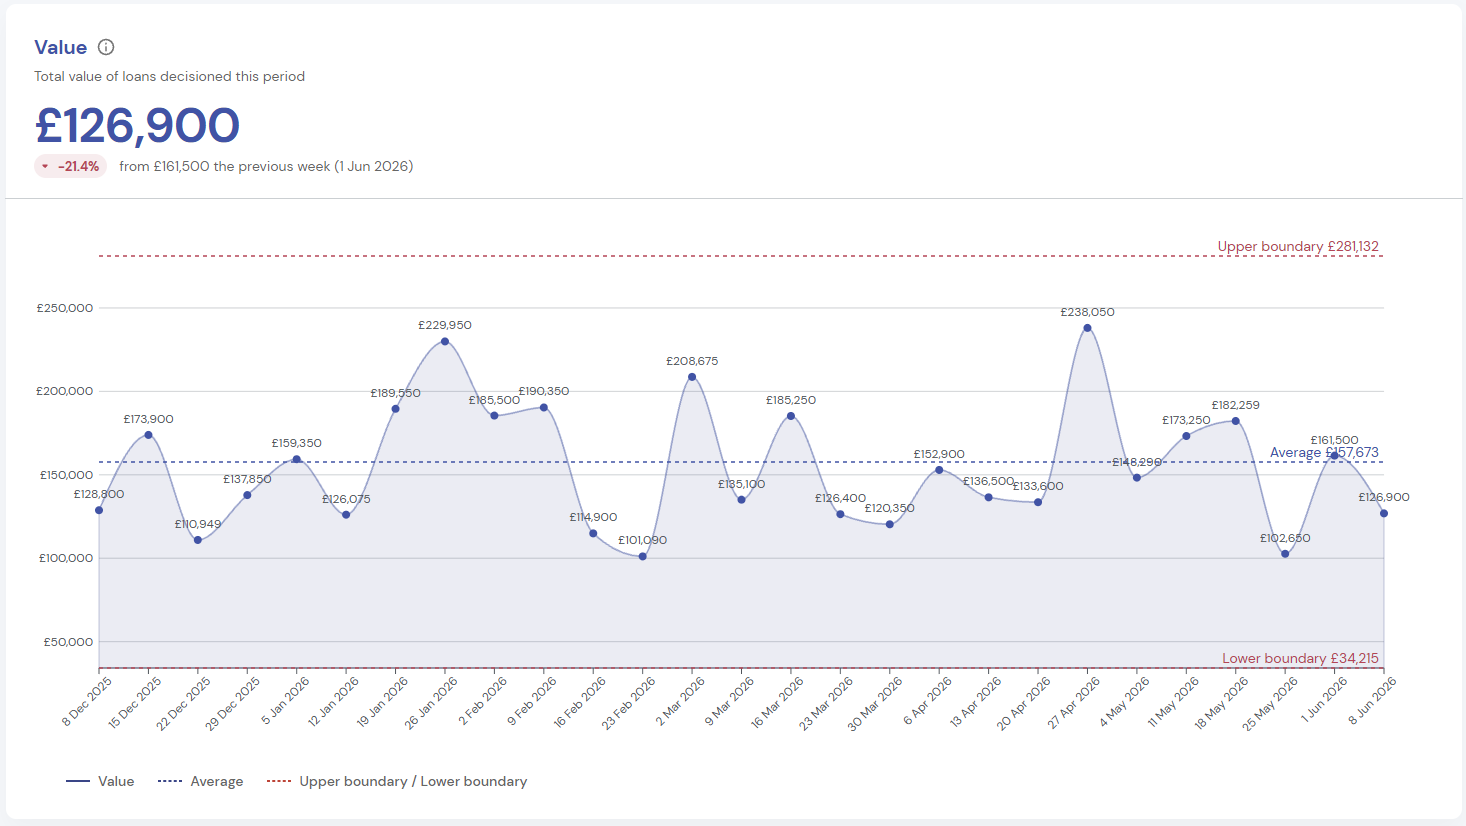
Turnaround rate
This is the headline growth metric. It shows the percentage of decisions returned within 24, 48, and 72 hours, plus those that remain unfinalised. Based on NestEgg data across 50+ UK credit unions, those turning more than 70% of loans around within 48 hours are growing at over 20% per year. Those turning fewer than a third around within 48 hours actually shrank by 5% in 2025. The relationship between speed and growth is one of the clearest patterns in our data. Members who get fast answers stay; members who wait often go elsewhere.
Automation rate
Shows the percentage of decisions made without manual review. A rising automation rate alongside stable delinquency is a signal that your credit policies are well-calibrated and members are getting faster answers.
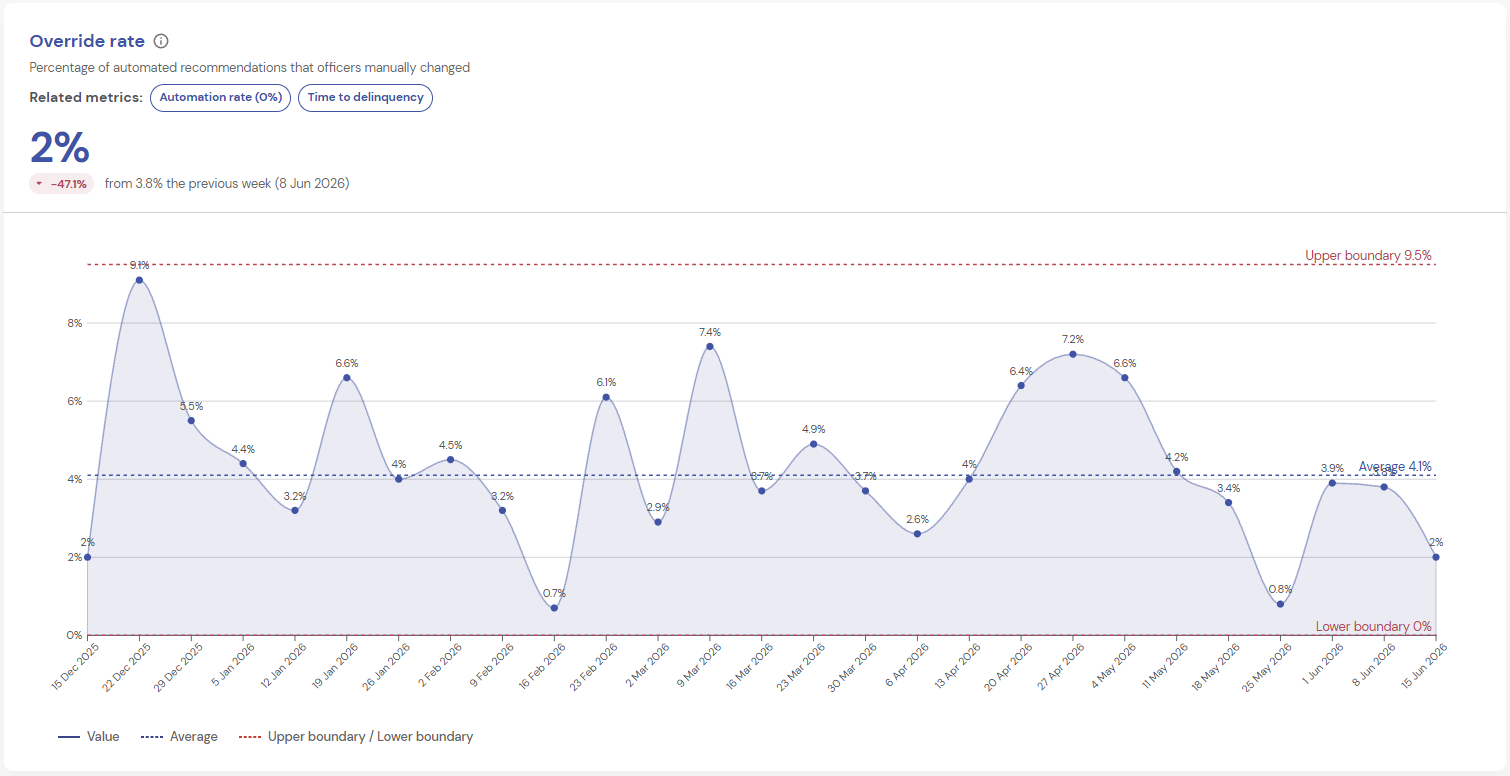
Override rate
Shows the percentage of automated recommendations that loan officers manually changed. Viewed alongside automation rate and early delinquency, it tells you whether human intervention is adding value or introducing inconsistency. If officers are frequently reversing the Decision Engine‘s recommendation, that may reflect good judgment – but it may also indicate misaligned policy. Either way, it’s a conversation worth having, and one that’s impossible without the data to see it happening.
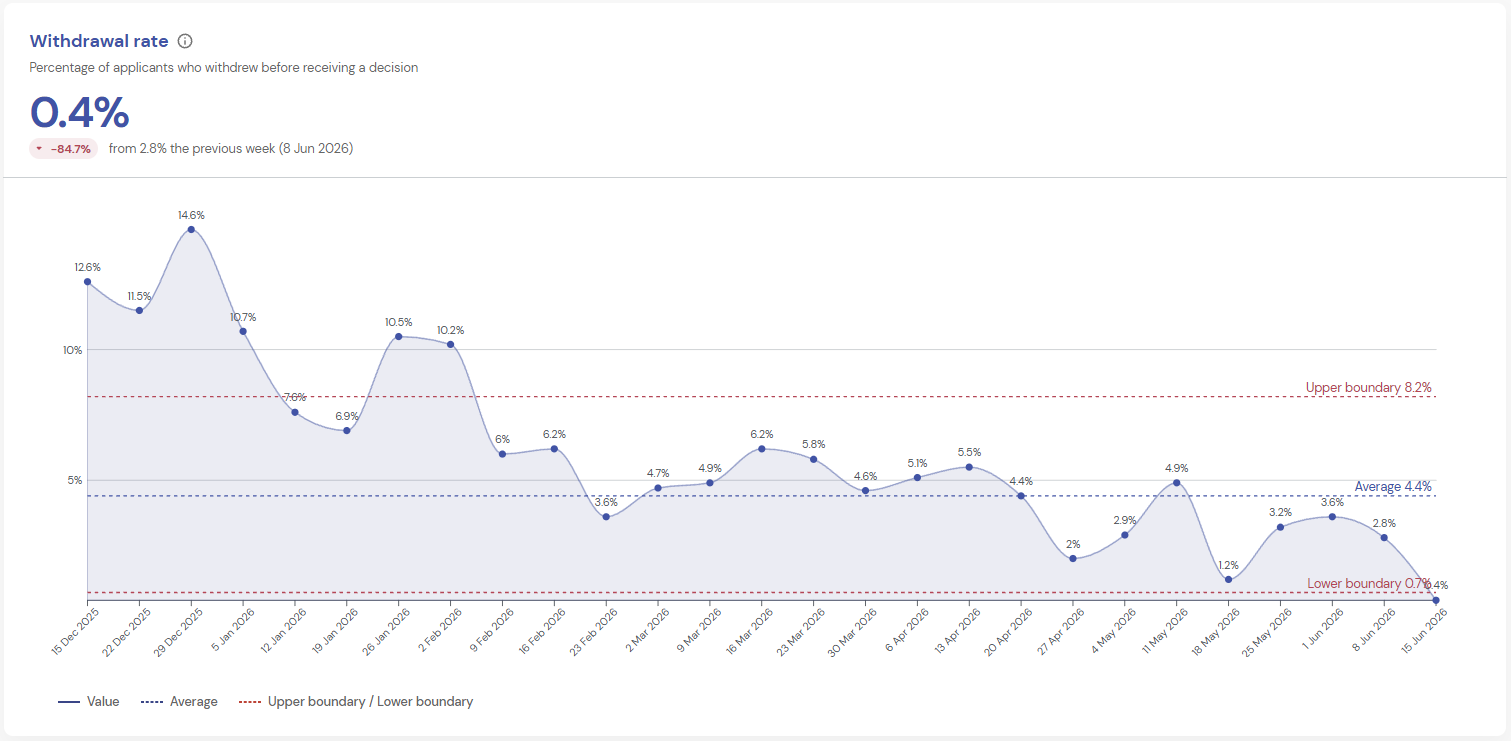
Withdrawal rate
Shows the percentage of applicants who abandoned their application before receiving a decision. Members who submit an application and walk away represent a lost lending opportunity that’s invisible without a dedicated measure. A rising figure can indicate friction in the application journey or delays long enough to send members elsewhere.
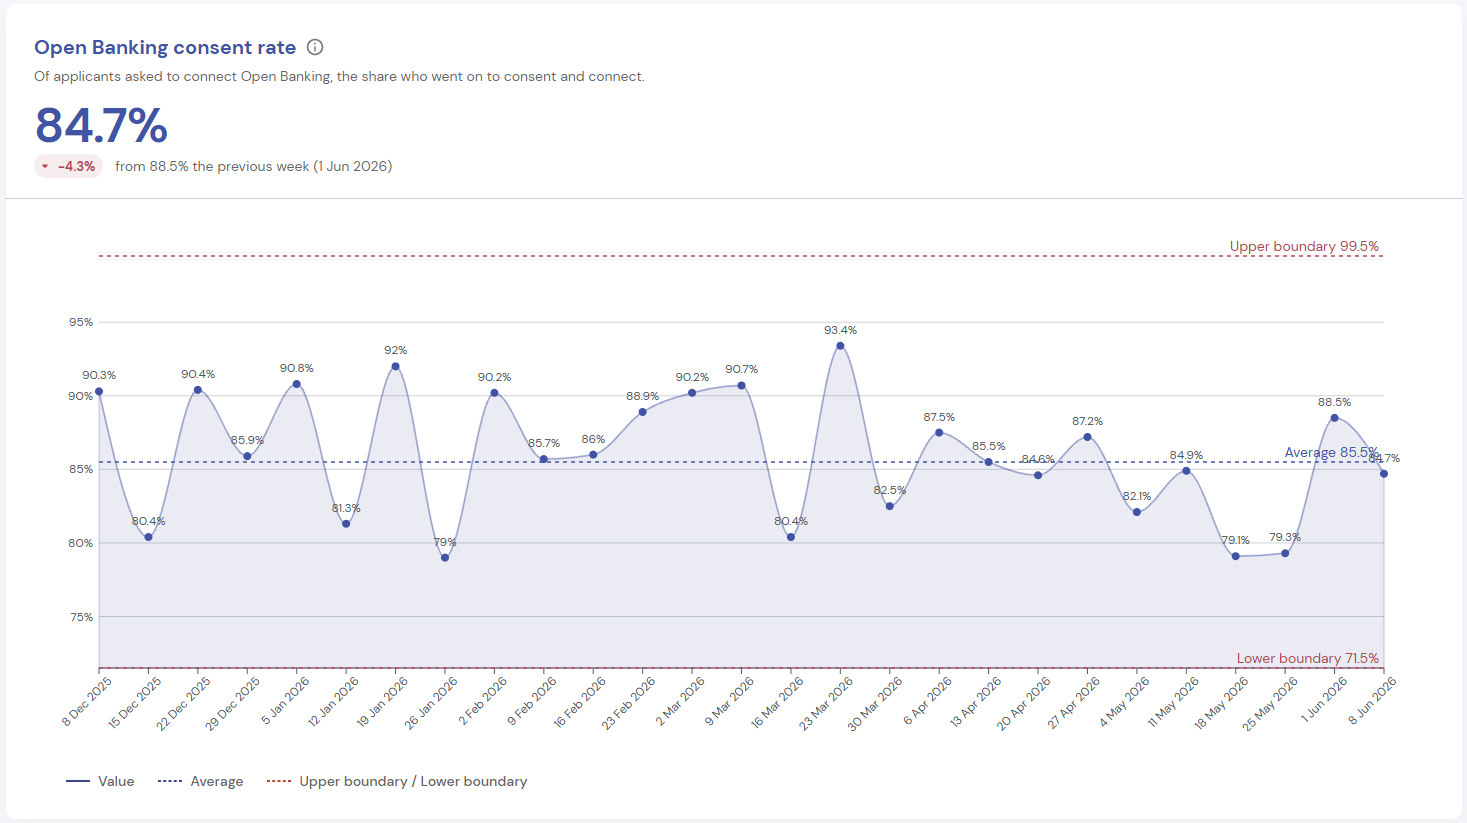
Open Banking consent and utilisation rates
These complete the operational picture. They tell you how many members are connecting their bank data and what proportion of those connections are actually informing decisions. Members who connect their bank data get faster, more accurate affordability assessments – and our data shows those loans perform significantly better. Open Banking isn’t just a regulatory feature; it’s the single biggest lever for reducing early delinquency.
Portfolio Health: are we growing within our risk appetite?
Portfolio Metrics
Draw from the resorts submitted monthly to the credit bureau and provide the regulatory-aligned figures that boards need. They update monthly and are calculated in a way that closely matches what you’d submit to your regulator.
Portfolio Status
Breaks down your matched loan book into four categories: On Time, Early Arrears, Bad Loan, and Default. These are the same categories your regulator expects to see, matched to the decisions made through your system. The breakdown tells you at a glance how healthy your book is – and the trend over time tells you whether it’s getting better or worse.
Time to Delinquency
This goes deeper. By showing when loans first became delinquent relative to their origination date, it helps distinguish between two fundamentally different problems. If a loan goes bad within the first 108 days, that’s likely an assessment issue – something the decisioning process should have caught. If it goes bad after 12 months, that’s more likely a change in the member’s circumstances that couldn’t have been predicted at the point of decision. The distinction matters because they require completely different responses: one means reviewing your lending criteria; the other means reviewing strategies for intervention for long-term borrowers.
What your board sees
Each month, Performance Analytics can generate a board-ready report that puts all of this in context – operational efficiency, portfolio status, and delinquency analysis with narrative commentary that explains what the numbers mean and whether they warrant action. It’s the kind of evidence that makes the difference between a board that asks “what’s happening with our loan book?” and one that already knows.
Turning monitoring into insight.
Performance Analytics doesn’t just add more metrics to your dashboard. It makes the ones that matter impossible to ignore – so lending managers act faster, boards see the evidence, and your loan book reflects it. As a result, it empowers better decisions through precise credit union lending metrics.
If that’s not what your current dashboard is doing, we’d like to show you the difference. Book a demo by completing the form below.
Book a demo now
Get insights into responsible lending
Enter your email to get insights once or twice a month
No spam. Unsubscribe anytime.